Nikkei 225 Candlestick Pattern Suggests More Selling to Come
Japan’s benchmark Nikkei 225 has posted its longest “black candlestick” pattern in 12 years on its chart, suggesting strong selling pressure could continue to weigh on the market.
The pattern, which occurs when the index rises and then settles lower than its opening level, has appeared for 11 straight days and is the longest streak since May 16, 2012, when the index fell for three weeks to hit its lowest level this year.
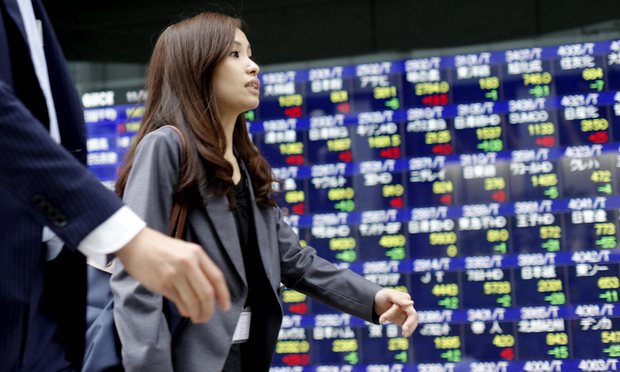
“The stock market is pricing in political instability,” said Ryuta Otsuka, a strategist at Toyo Securities Co. Investors who bought Japanese stocks in hopes the election would be a good opportunity are now dumping their holdings on speculation the ruling Liberal Democratic Party will struggle to maintain its majority, he said.
The Nikkei 225 stock index has fallen 4.5 percent since Oct. 15 when campaigning for the lower house election began, reversing a historical pattern since 1990 that has seen the benchmark index rise in the weeks leading up to all of the last 11 snap polls. Support for the ruling coalition has been weakening ahead of next weekend’s vote, two polls showed, suggesting the possibility that the election could result in a weak and unstable government.
Source: Bloomberg